Speed Up Page Load Times with the CCP’s Site Performance Metric
Here at CloudAccess.net we host a myriad of websites ranging from personal portfolios to impeccable business portals. More often than not, the sites get great amounts of organic traffic from search engines, and in 7 out of 9 cases the landing page is the homepage. Since the landing page is such an important aspect of the website model, designers strive to ensure a great user experience by establishing a good impression for site visitors. This blog explains how to use the Site Performance tool within the Cloud Control Panel™(CCP) to analyze page performance.

Joe Average Designer: “I just grabbed a swanky GNU template, stamped my name on it; strung together some sizzling plugins and a hi-res HDR photo as the website background. Cool, eh?”
*Bzzzzzt* Wrong! Our friend Joe here just overlooked page load time. The typical web surfer is alleged to have an average attention span of a meager 8 seconds. Blame it on the fast paced quirks of social media. As a result, designers face the challenge of converting that user to a client within those 8 seconds of judgement.
If the page takes 6 seconds to load, the user is already off checking out the next Taylor Swift video on YouTube. Here’s where our Site Performance feature comes in handy.
About the Site Performance Tool
To put it lightly, the Site Performance feature emulates a browser-like request to a page on your website and returns a browser-like breakdown of what the response looked like including the time it took the page to load.
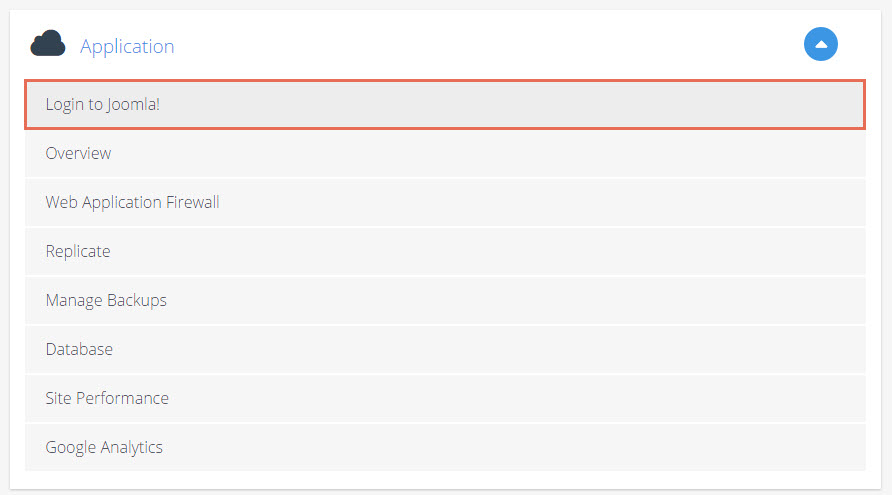
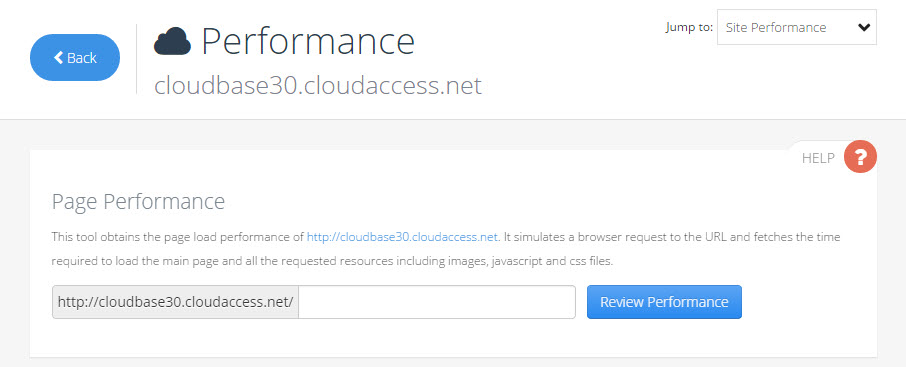
Let’s take a walk through the Cloud Control Panel™(CCP) to check out the Site Performance tool. The feature sits nicely under the Application menu.
Now the first thing you’ll notice is that you can review the performance of any particular subpage of the site, this enables you to evaluate all of your common landing points/pages.
“This site is so slow to load. I just spent a fortnight wrenching on my hair and I now have a receding hairline. I need to see what’s causing such a poor hits-to-client conversion ratio on my website.”
Let’s leave Joe to his shenanigans for awhile and check our own CloudBase 3.0 site using the Site Performance tool.
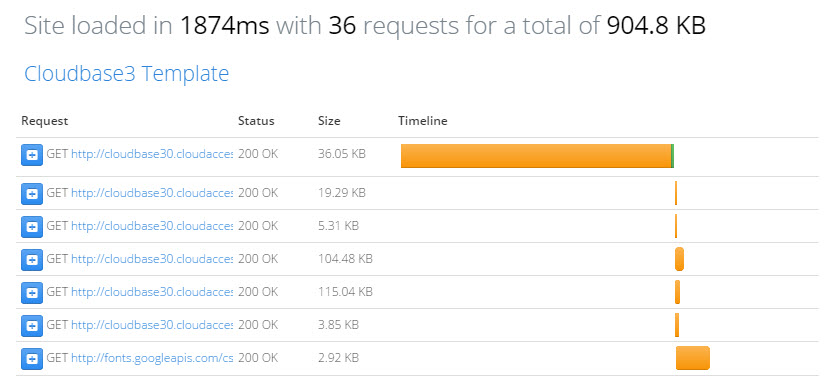
“Whoa! that’s a neat site and it took less than 1 second to load. Users will have 7 seconds to look around the page!”
Indeed that’s true; you can even hover above the trimmed URLs to view the complete one and click to visit them.
“But wait! Why the 36 requests? I see the site loaded within 0.7 seconds.Then what’s with the 1.3 seconds?
It’s simple really: a single page load request leads to a cascade of scripts and stylesheets that have to be loaded, which can request additional resources (likes images, fonts, etc.). So, all-in-all, we had to execute a total of 35 additional requests for resources.

“I guess I’ll rethink my wise idea of including all those plugins and that high resolution HDR image on my website.”
Good idea, Joe.
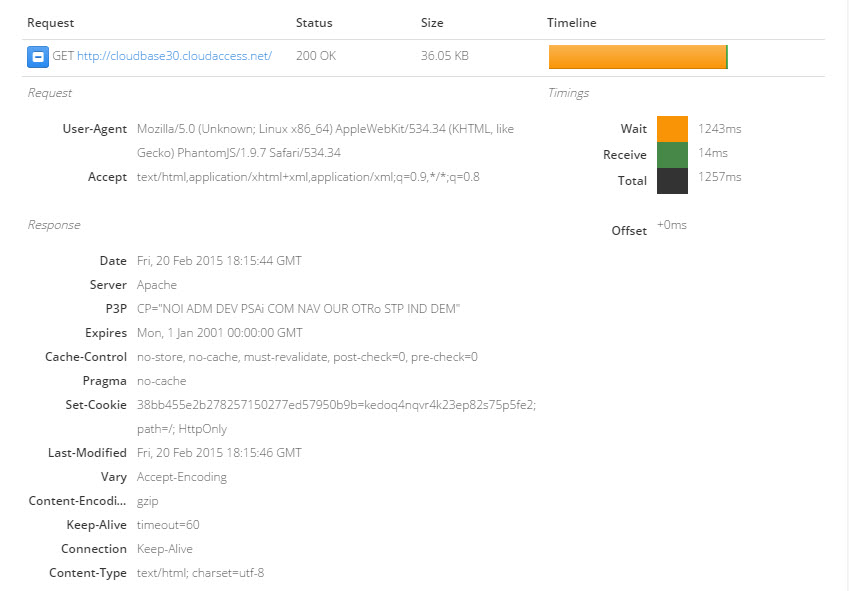
Expanding the individual request reveals technical mumbo-jumbo for the nerd hatters, along with the breakdown of the load time. In the example below it took us 1243ms to establish the connection and 14ms to receive the data. Browsing through this step-wise breakdown of component load time can help users detect which resource is causing the greatest lag and assist them in taking adaptive measures.
“I finally realized what was causing that loading spinner to spin those additional 4 seconds when everything else seemed to have loaded.”
Great job, Joe!
The basic principle is straightforward - the more you include plugins and external aesthetics, the greater the requests will be made to load a given page.
“Wait a minute … are you trying to say that I should stay clear of plugins and images?”
Now don’t jump to conclusions. No, I’m not snubbing external resources because of Browser Caching. Web browsers, our smarter-than-the-average-program, utilize a cool feature that lets them cache these requests/resources. Any users coming to your site for a second time in a finite amount of time will not have to spend the precious milliseconds in fetching them again. The browser loads them from its local cache, achieving a speedup of great proportions.
“What does that mean for the website then?
It means that designers have to use their best judgement in how much data they should put within the site. Images should be resized appropriately before uploading them to a site. Fetching a hi-res image and resizing it within HTML to use as a thumbnail is highly detrimental to the page performance. Also, clustering all the plugins and loading them on all the pages is just as bad.
“So I’m going to minimize the scripts, remove unutilized plugins and frantically resize hi-res images on MS-Paint. Then I’ll use the Site Performance tool to test page performance. Sound good?”
Exactly, Joe - you got it!
In the end, it boils down to a few simple tips:
- Use images, plugins and scripts modestly to reduce the amount of cascade requests your page will make.
- Use analytics tools to minimize the amount of time a user spends on your site waiting for it to load.
- Provide them with rich content so the impression sticks with them for longer. Make them linger. They can always watch Taylor Swift videos on YouTube later while at work.
Godspeed, Joe.
About the author