Top 5 Google Analytics functions that you need to know
You don’t need to be an analytics expert to gain important knowledge from Google Analytics. Here are 5 important functions that you should know about.
Dashboards
Google Analytics Dashboards are a collection of simple widgets that allow you to view and monitor key reports and metrics you care about the most. You can create different types of Dashboards suited for different occasions. For example, you can create a Dashboard that tracks your mobile performance or a Dashboard that shows you real time tracking of your website.
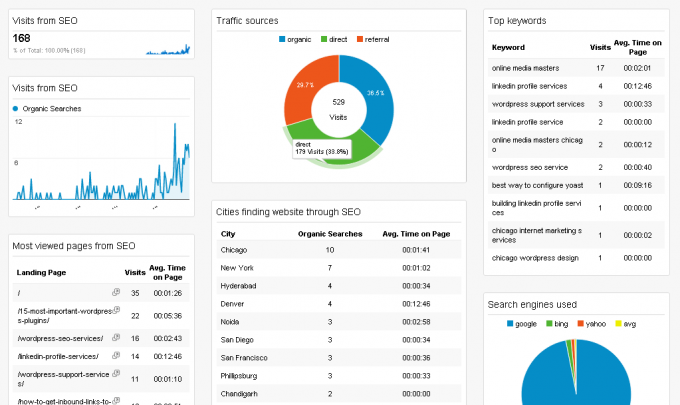
One of the great things about Dashboards is that they are easy to create and customize. To create your own Dashboard, login to your Google Analytics account and from the left side menu select „Customization” -> „Dashboards”. Then click on the „Create” button. You can start with a „Blank Canvas” or use a „Starter Dashboard”. You can also import a Dashboard from Google’s Dashboard Gallery. To do that, just click the „Import from Gallery” button.
Audience Overview
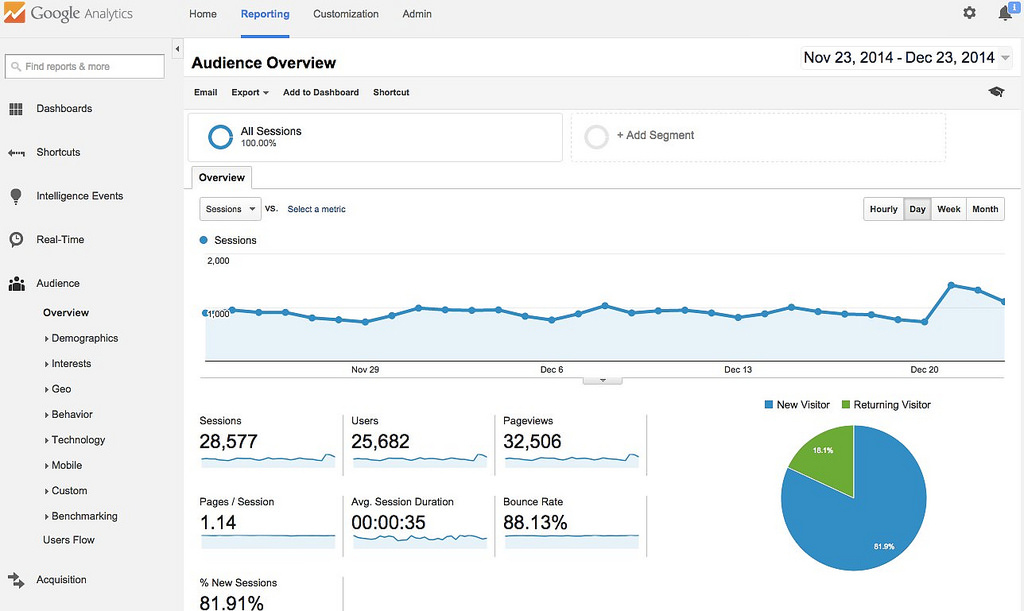
Audience Overview is one of the key functions in Google Analytics. To access it just click on the „Overview” in the „Audience” section. Audience Overview provides an overview of what’s happening on your website including the number of sessions, users, pageviews, demographics and many more. You can also modify the graphs to display different metrics using the dropdown menu at the top of the page.
Annotations
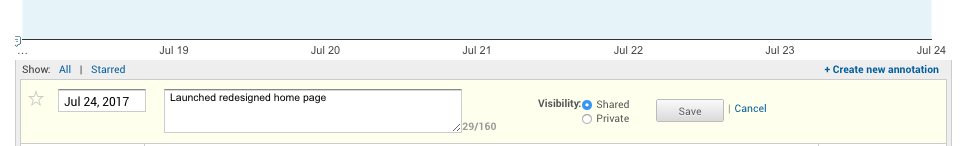
Annotations is a simple tool that can really be handy. Basically it allows you to create notes for specific dates. Imagine this scenario: you sent a Newsletter to your clients on June 2nd and you forgot about it. A month later you can see a huge traffic spike on June 2nd and you keep wondering why. With Annotations you can create a simple note in Google Analytics that says „Newsletter sent to 5000 customers”. To create annotations, go to any report and click the down arrow on the tab at the bottom.
Campaign Tagging (UTM code)
This tool will help you collect information about your marketing efforts including but not limited to email campaigns, banners, social media campaigns etc. Basically every marketing campaign where you use a hyperlink. All you have to do is tag the link with your UTM code. Google Analytics will read the parameters from that link and display it in „Acquisition” -> „Campaigns” view. Depending on how detailed your UTM code was, you’ll be able to see what sites your campaign was displayed on, the exact banner that was clicked or what keywords were successful. You can use a simple URL builder from Google to tag your hyperlinks.
Pages
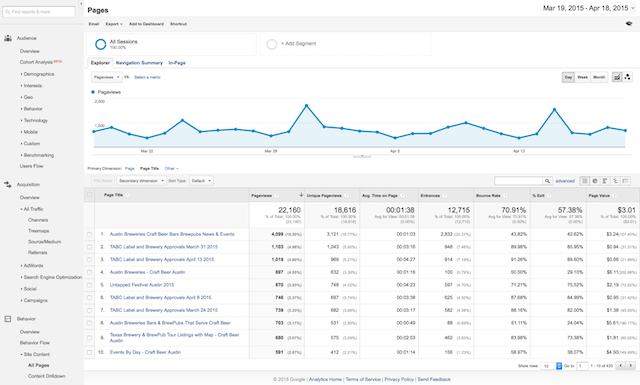
And last but not least is the „Pages” report. To access it, from the left side menu select „Behavior” -> „Site Content” -> „All Pages”. This report will let you know how specific subpages on your website perform. You’ll be able to see various statistics including Pageviews, Unique Pageviews, average time spent on that page and bounce rate. And just like in „Audience Overview” you can modify the graphs to display different metrics using the dropdown menu at the top of the page.
About the author